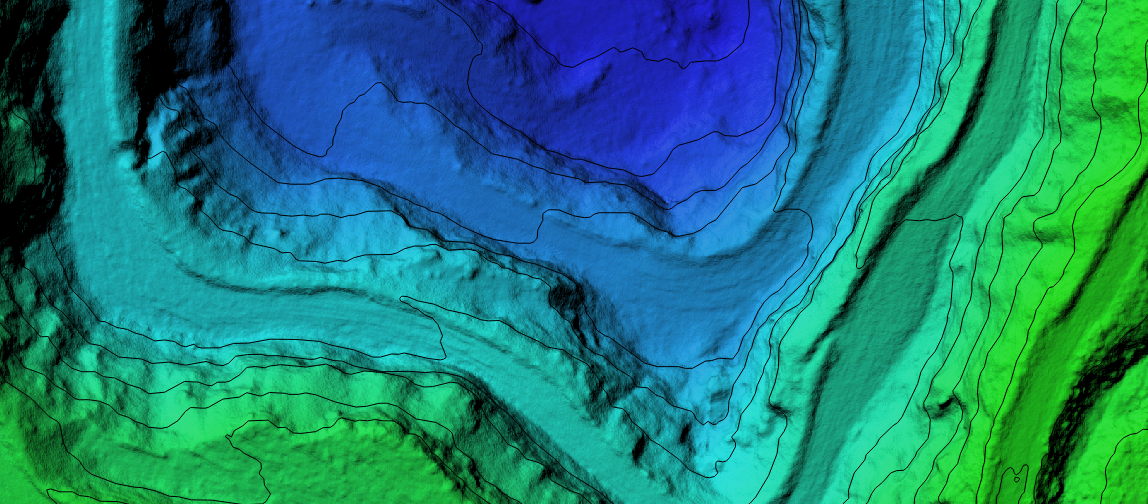
The Metashape Pro edition includes the ability to create contour lines. They can be created using DSM (digital surface model) or DTM (digital terrain model).
You can find useful information about how to build DSM or DTM in our articles:
Aerial data processing (with GCPs) - Orthomosaic&DEM generation
Aerial data processing (without GCPs)
Aerial data processing(SenseFly eBee)
The article describes the following steps:
Generate Contours
For the entire DEM surface
Generate Contours... command is available either from DEM label context menu on the Workspace pane or from the Tools menu. Select Tools > Generate Contours...
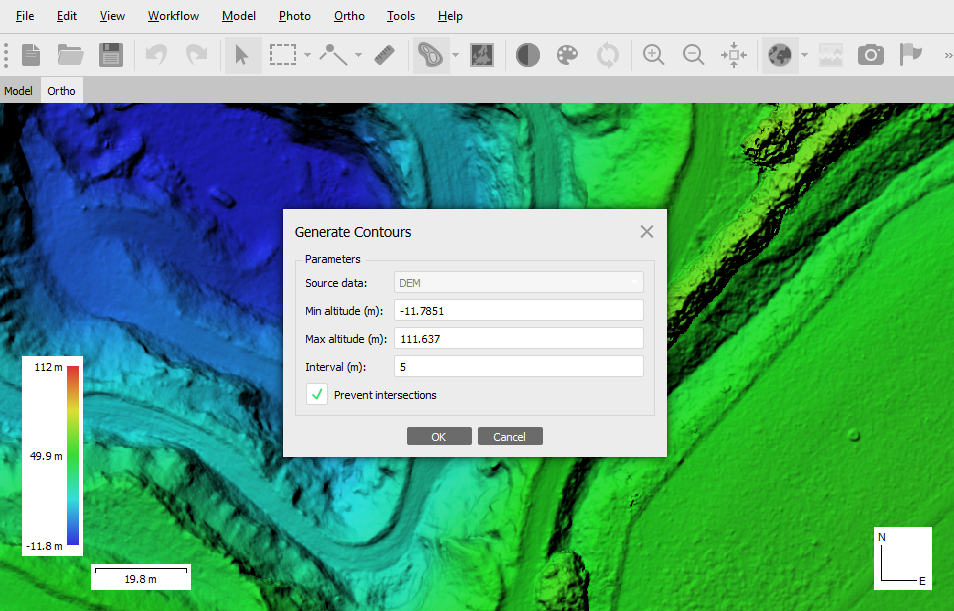
In the Generate Contours dialog window you need to et values for Minimal altitude, Maximal altitude parameters as well as the Interval for the contours. The min and max values are usually added automatically based on the information received from DTM or DSM. All the values should be indicated in meters. Click OK button once done.
The active DEM in the project is taken into account. If you have multiple DEMs in the project, before creating contour lines, make the required layer active by selecting the Set active command from the DEM context menu on the Workspace pane.
When the procedure is finished, a shape layer with "contours" label will be added to the project file structure shown on the Workspace pane.
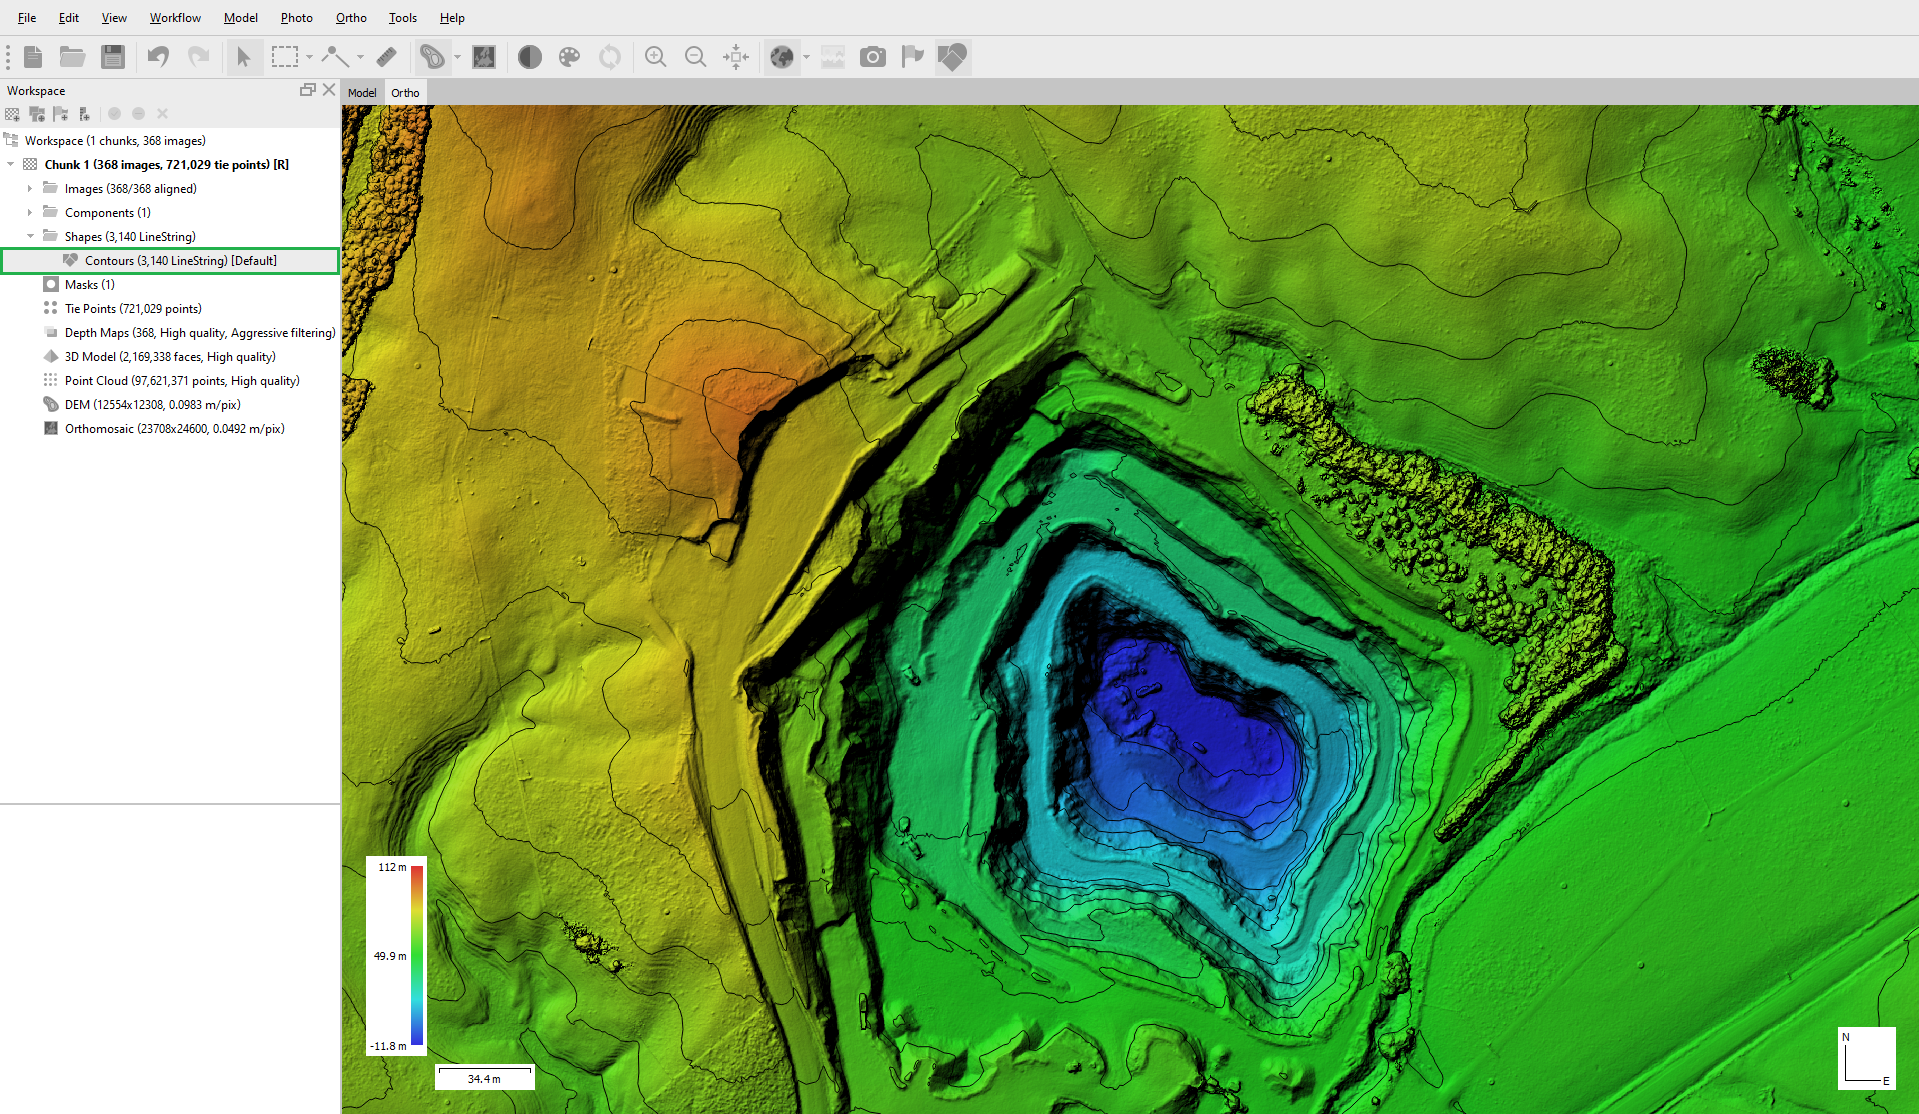
To make the layer with contour lines visible, check that the Show Shapes on the Toolbar option is enabled:

For a small part of the DEM
It is possible to generate contours not for the entire surface, but only for the selected part. To do this, create a polygon around the desired area and specify the boundary type - Outer bounder:
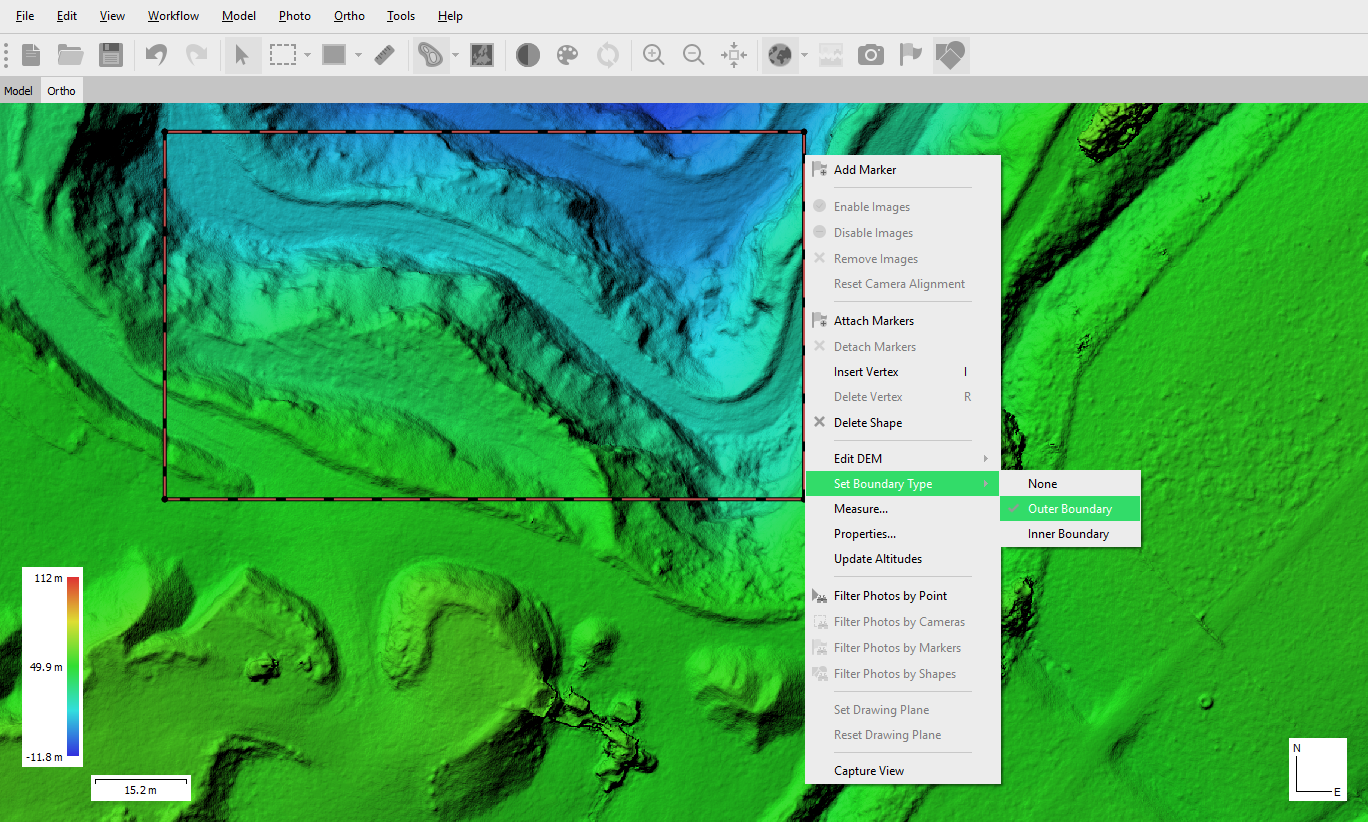
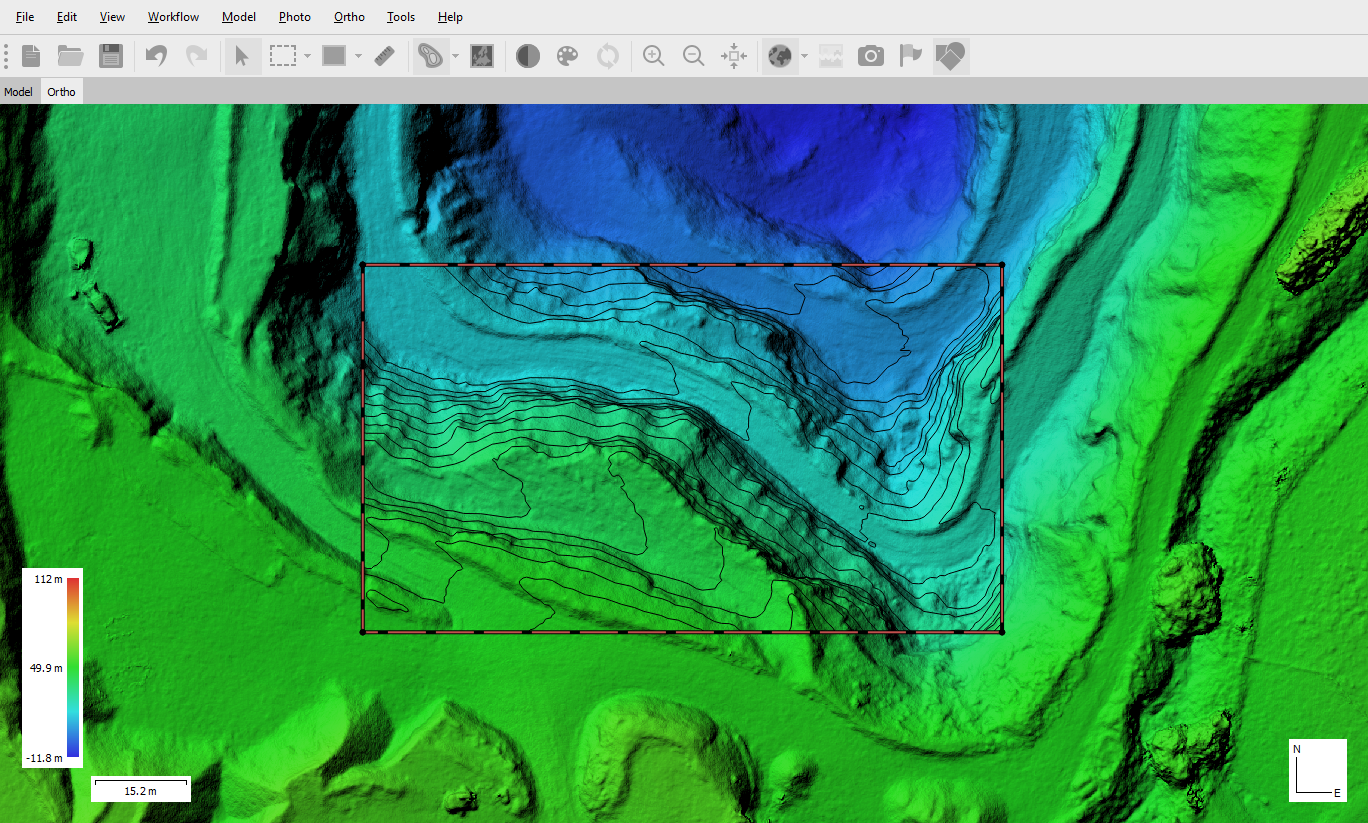
And after that select Tools > Generate Contours, by setting the necessary parameters for construction (in this case, we used an interval of 2 meters), you obtain the contours only for this area:
Edit Contour lines
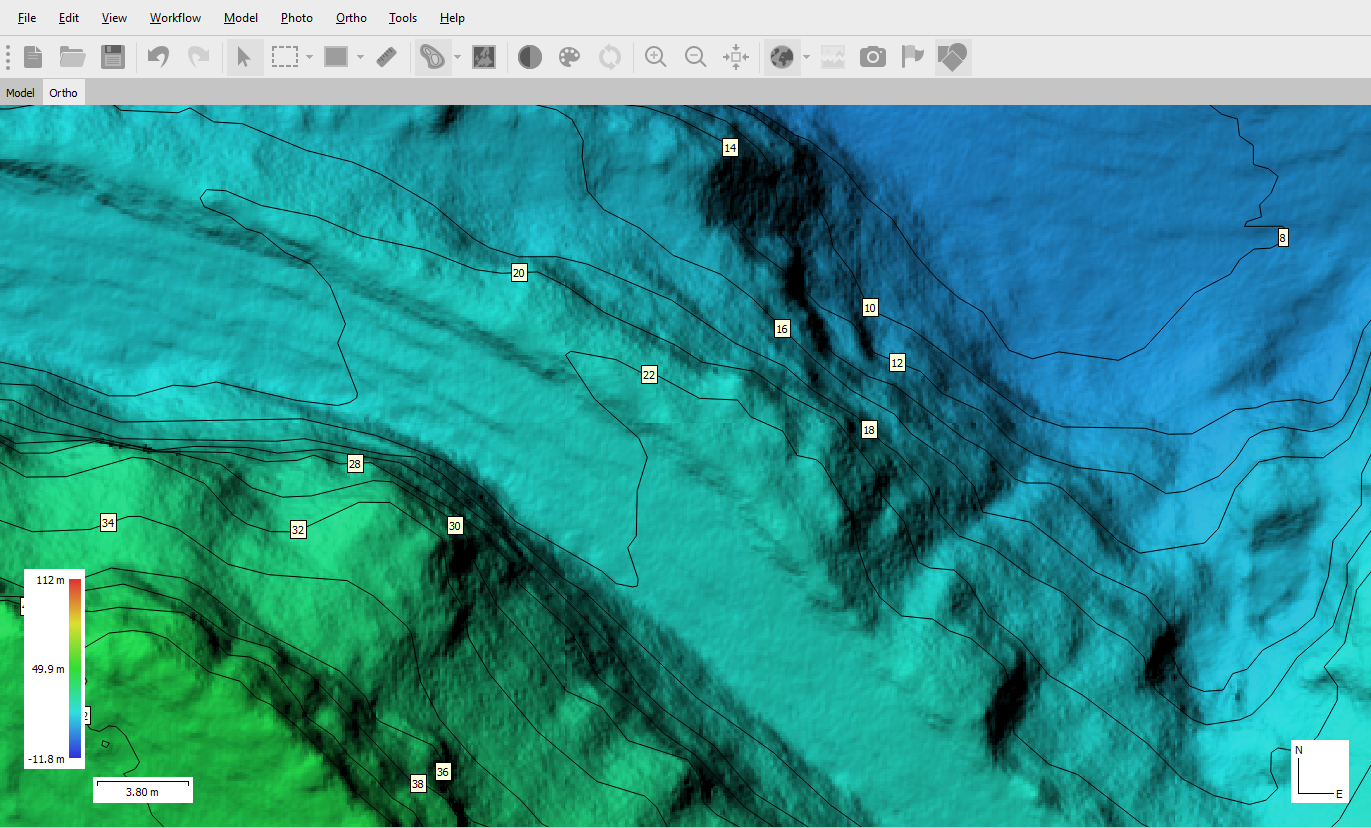
To display the labels for the contour lines, you need to select Otho > Show/Hide items > Show Labels (on the screenshot below, the contours with an interval of 2 meters ):
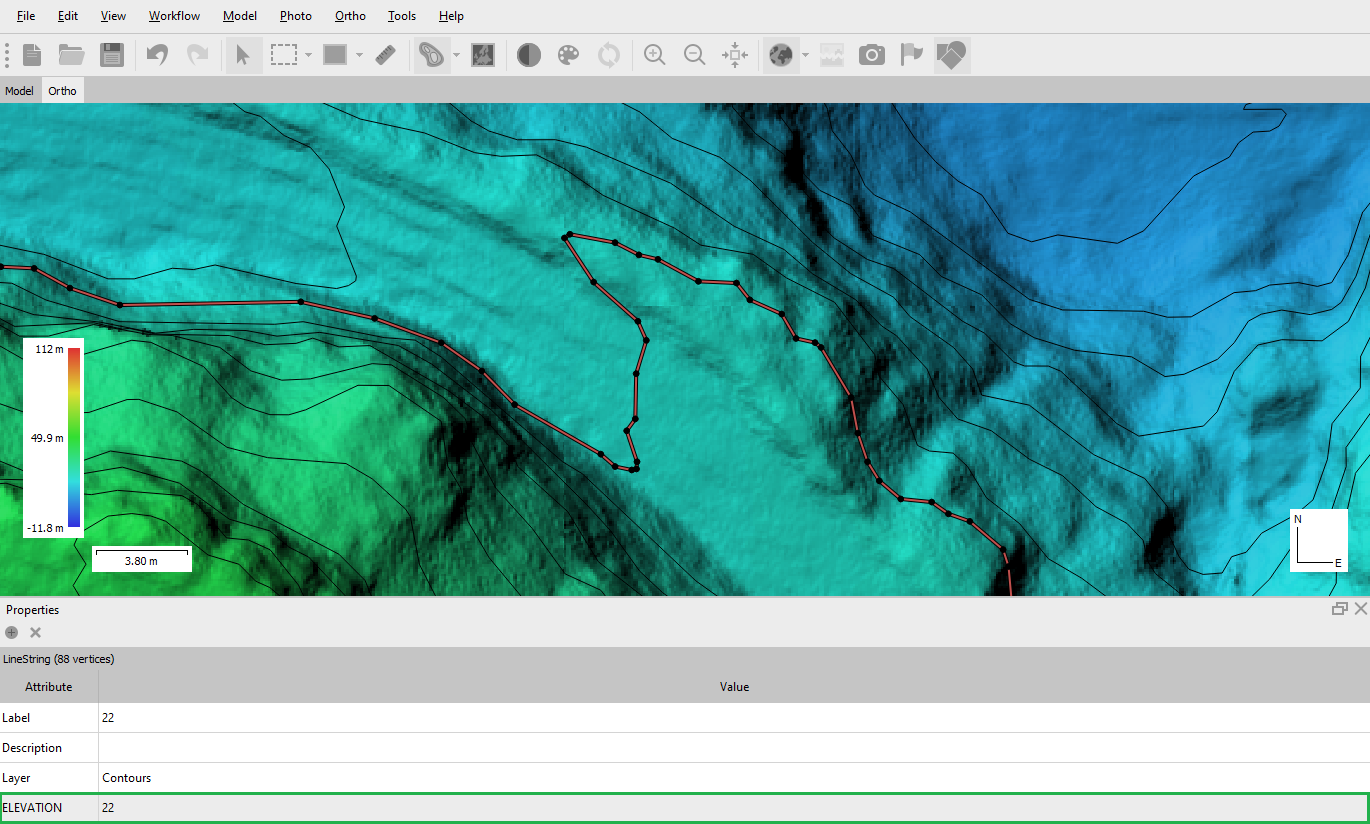
Each contour can be edited manually if necessary. For example, you can make it smoother by removing vertexes. You can delete the vertex via the context menu or by hovering the mouse over the vertex and using the hotkey "R":
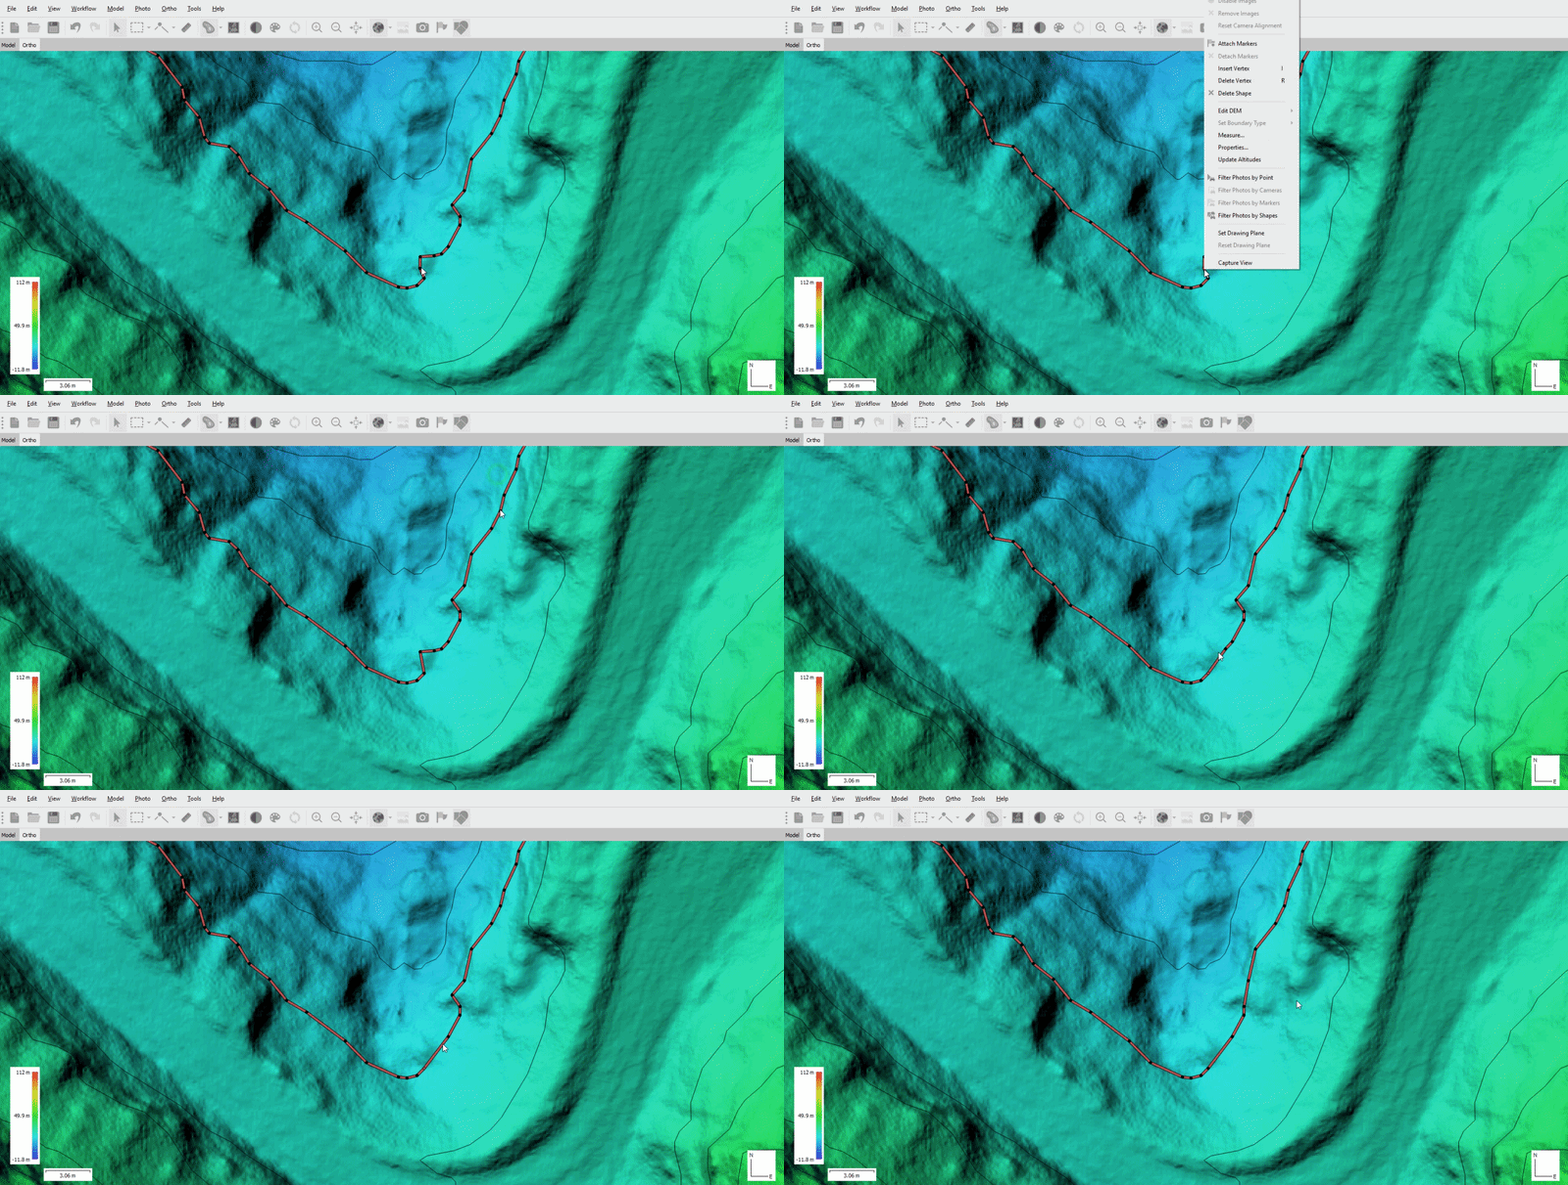
You can also adjust the color for the vertexes. To do this, in the context menu of the Сontours layer, select the Properties... command and choose the desired color:
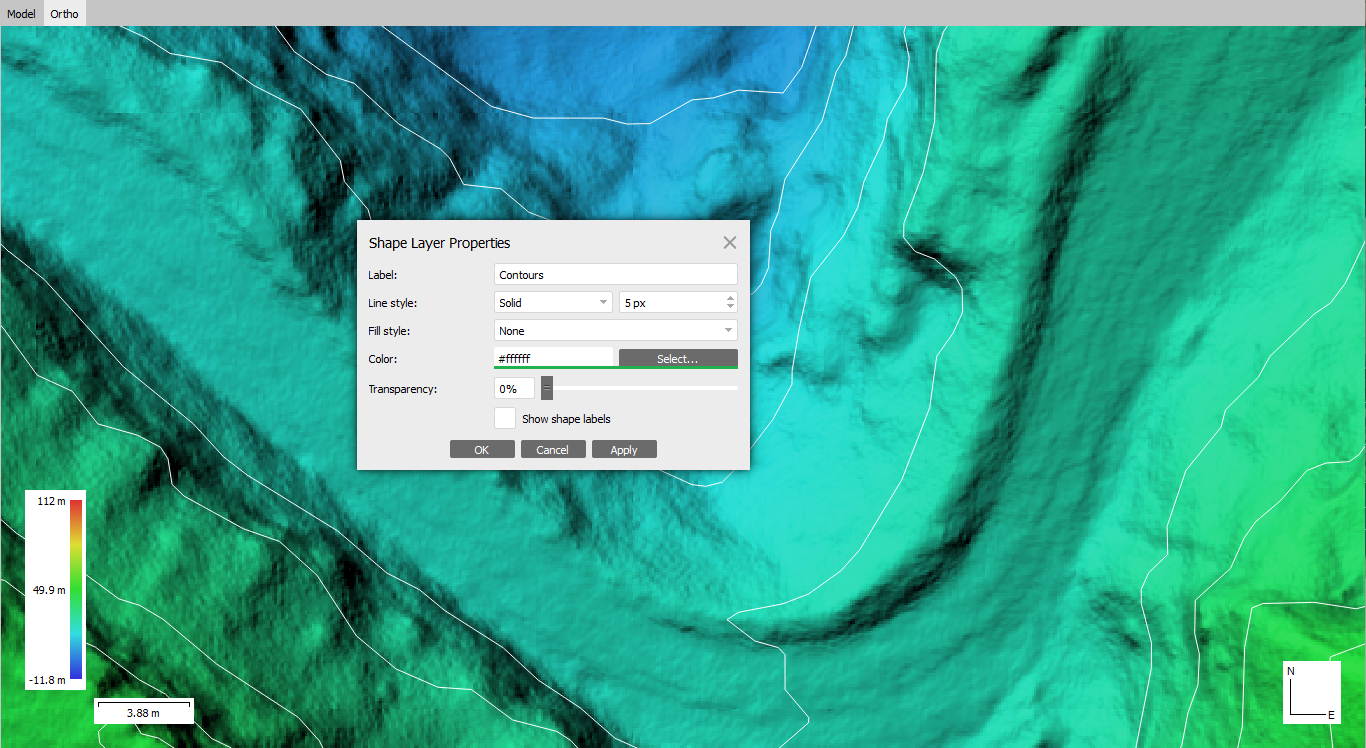
Export Contours
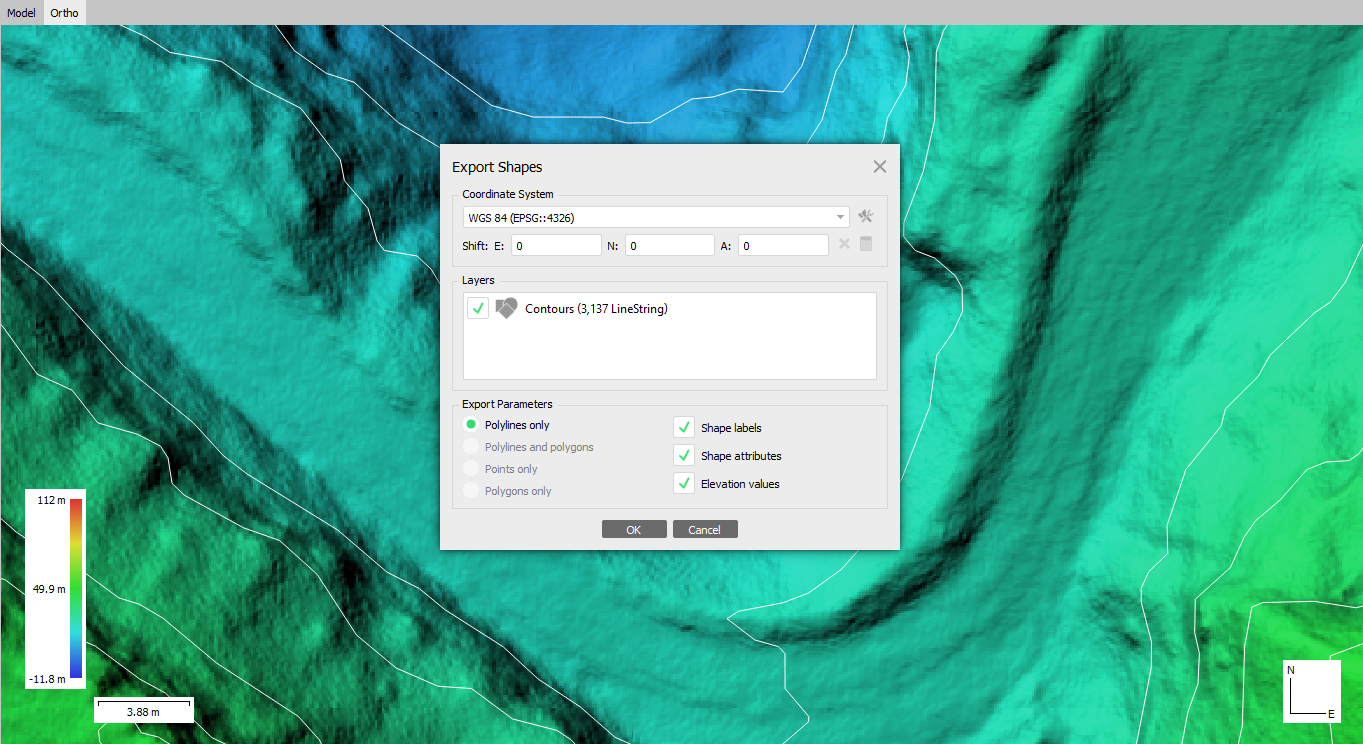
Contour lines can be exported using Export Layer command from the contour lines label context menu on the Workspace pane. Alternatively the command is available from the File menu. Сontours can only be exported in one of the following formats:
- Shape Files (*.shp)
- DXF Files (*.dxf)
- KML files (*.kml)
- KMZ Files (*.kmz)
- GeoJSON files (*.geojson)
- GeoPackage files (*.gpkg)
- Survey Points (*.txt)
In the Export Shapes dialog it is necessary to select the type of the contour lines to be exported. A shape file can store the lines of the same type only: either polygons or polylines.